When Data Met Time: An Unlikely Love Story
With the addition of time, data goes from static to temporal or even time series. Find out how this can empower your data...
Data, much like the foundations of a house, is rarely useful by itself. When those foundations are strong, much can be built on top of them, but if they are weak or inconsistent, the whole structure is at risk of subsidence. Most data used by companies is collected in a raw format from multiple sources. However, even good, consistent data needs processing for its true value to be realised.
"Like oil, data is valuable, but if unrefined it cannot really be used."
Clive Humby
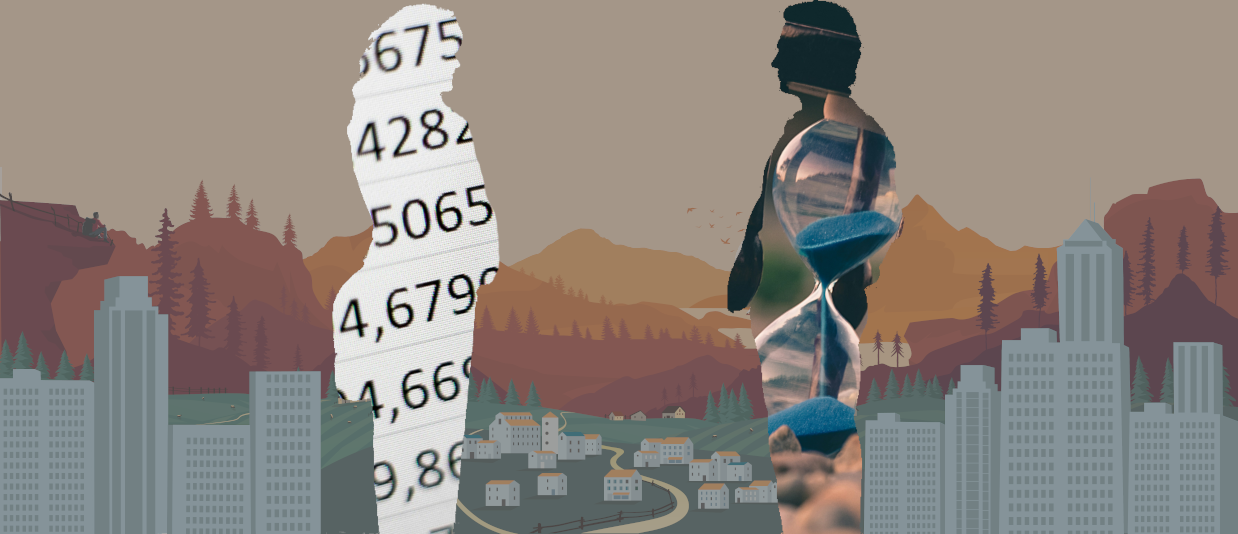
Time is one of these elements in data which is often ignored, even though it can fundamentally alter its application. Measuring temperature without recording time will create a collection of data points but, when time is included, we can generate trends for further analysis.
 Heathrow, London hourly air temperature for 2022, demonstrating how time changes the story.
Time and Taxonomy
People love to group things, even when they exist on a spectrum, and time within data is one of those things. There are 3 common classifications for time: static, temporal, and time series.
Static
When data has no connection to time or is rarely updated, it's often referred to as static or, less commonly, atemporal. Passports are a simple example of static data as they contain details of our birth like date and location. Even though most people will go through several passports in their lives, this data remains static. From a geospatial perspective, country boundaries are commonly treated as static despite changing over time. This is because we have de jure (legally recognised) and de facto (in reality) country boundaries, between which differences are considered illegal. Pairing temporal or time series data with static data is common, though it's important to pair them appropriately as, for example, 1930s country boundaries won't align with modern administrative data due to country changes (splitting and joining) and boundary shifts.
Temporal
Data that contains time and is recorded periodically or more frequently is classified as temporal. The vast majority of data should fall into this category, but if the time element is lost for whatever reason, it will become less refined and static. Remotely sensed satellite data can fall into this category when acquired at irregular intervals; you can read more about remote sensing in our blog What is Remote Sensing?. Going back to temperature for an straightforward example: if you were to record the temperature outside of your house anywhere from once a year to multiple times a day, this would be considered temporal. If you were to set up a weather station that recorded the temperature every minute, this would become time series data.
Time Series
Time series is a sub-classification of temporal data which is produced at short regular intervals. This distinction can feel a little arbitrary, but time series data has some hidden powers we can unlock for really refined data and analysis. When data is produced at regular intervals, analysis through machine learning, deep learning, or good ol' statistics is greatly improved as the variability of time delta (the technical term for change) doesn't have to be taken into account. Time series data lets us measure changes (delta) over time, but when temporal data is used, the observed values must be interpolated (estimating new values between known values) first to get equal intervals. Any form of interpolation (linear, bilinear, quartile, etc.) is only capable of estimating the values between measurements and therefore might not represent the truth. The vast majority of ground sensed data will fall into this category, including data from weather stations, river gauges, IoT devices, and seismic sensors.
 Heathrow, London hourly air temperature for 2022, comparing static, temporal, and time series data.
Choosing a partner
Hopefully we've helped clear up some of the complexities around time categories in data and how they impact its use. Data has exploded in volume over the last 10 years and shows no signs of slowing down or stopping. Regardless, any amount of bad or inconsistent data can disrupt data modelling and analysis.
Using data for business insights or actionable intelligence is complex. At GeoTech, we can help you make sense of both your data and the wide range of data sources available. Whether you want to build predictive models, bespoke tools, or specialists to consult on geospatial data, we can help you utilise data better.
We're always happy to have a chat through any problems you have. Please get in touch with us or reach out on LinkedIn if you'd like to learn more.