What is Remote Sensing?
Ever wanted to learn about remote sensing by reading...
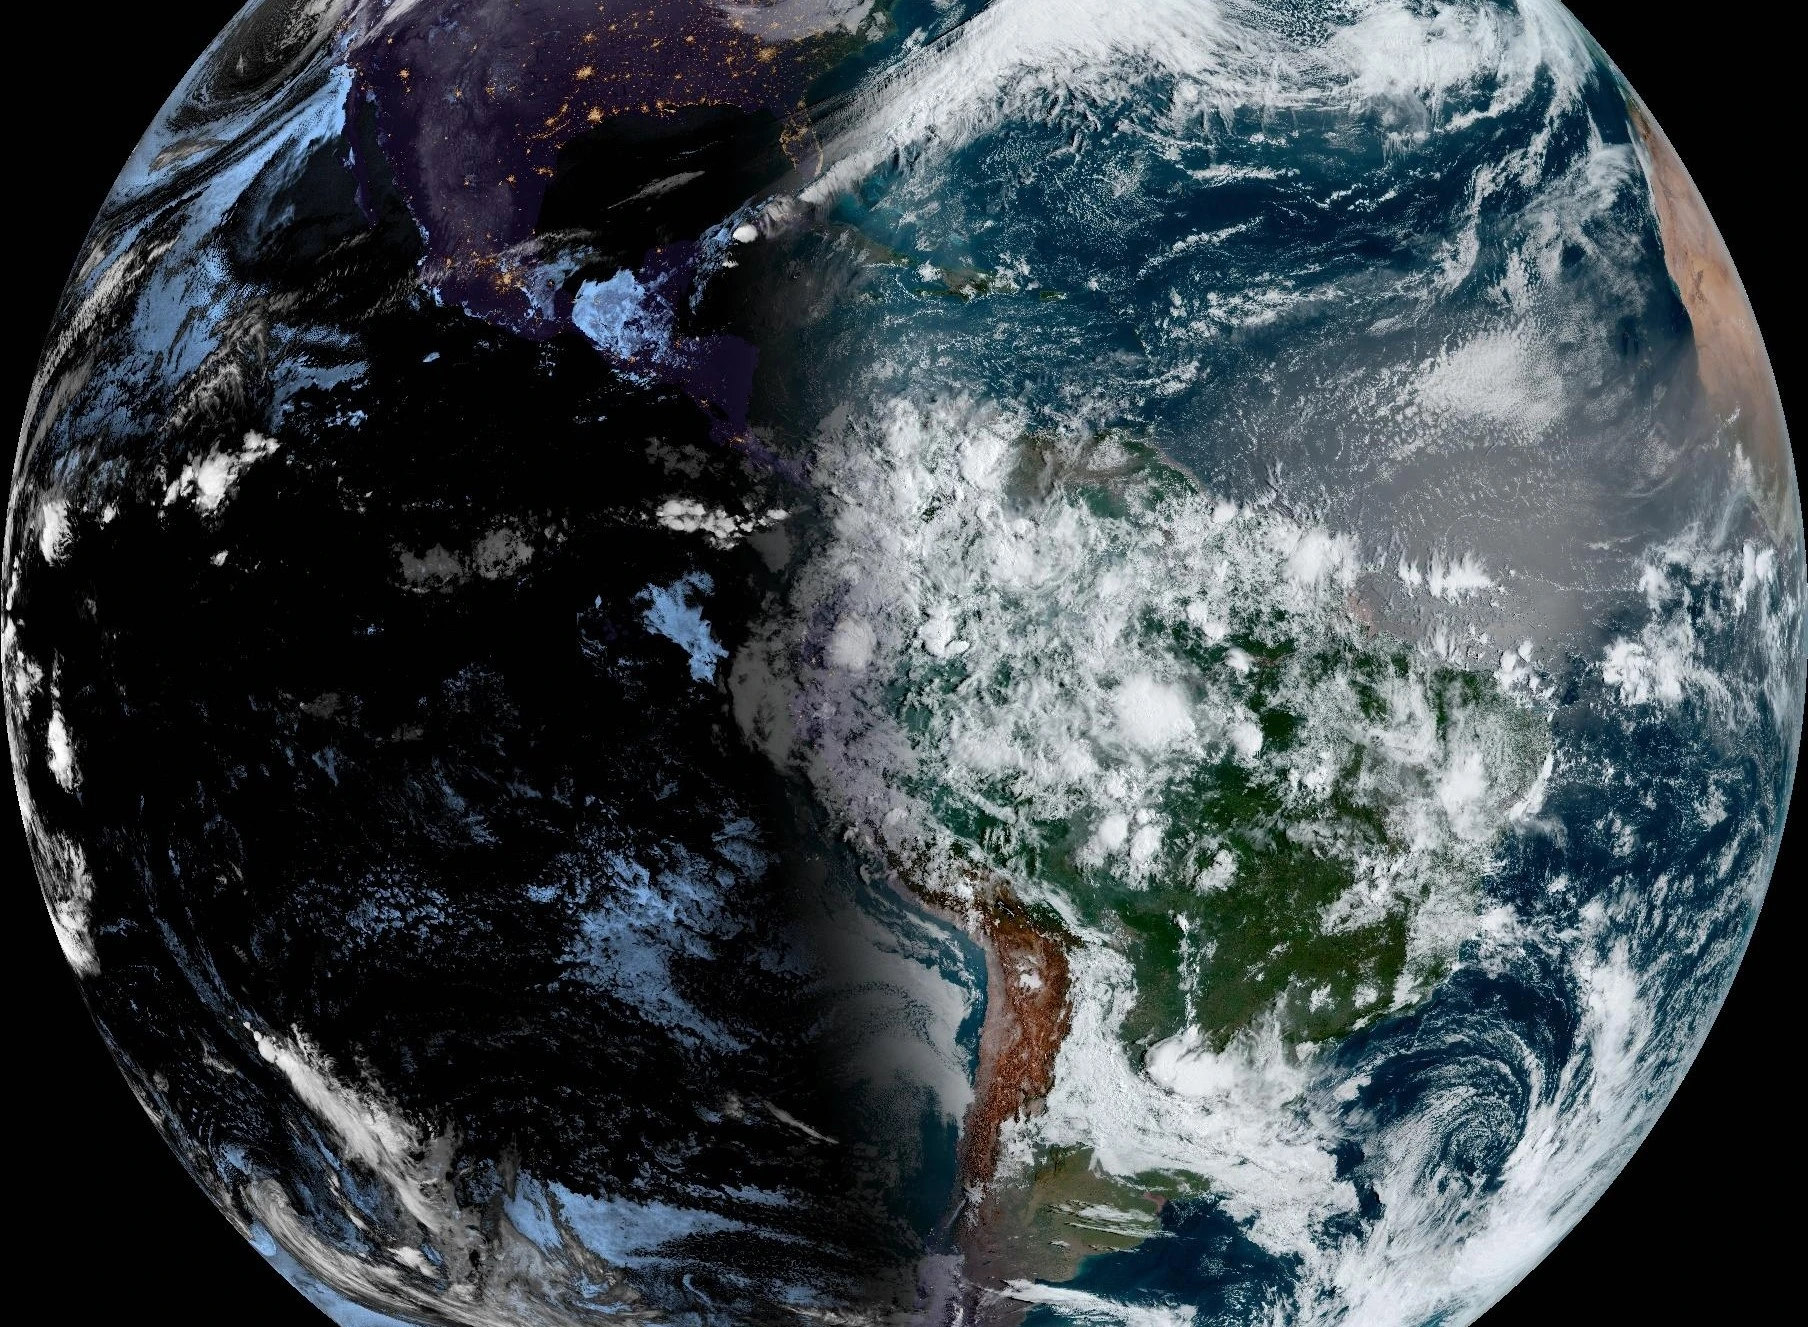
Remote sensing – if you don’t already know what it is, it's not entirely obvious. It refers to the observation (sensing) of features, objects, or phenomena from a distance, without direct contact (remote). In fact, it’s remote sensing that allows you to read this article! However, here the focus is on that of Earth – often referred to as Earth Observation, or EO – carried out by air- and space-borne platforms, particularly satellites, the myriad applications it encompasses, and the industry that drives it forward.
History
At the risk of emulating a remote sensing 101 lecture, a brief history of the field is usually beneficial, if not at least a little interesting!
The origins of non-biological (that is, without the eye as the sensor) remote sensing began with the first cameras and photographs in the early 19th century. Coincidentally, this coincided with several notable advances in the study of electromagnetic radiation (EMR), including the measurement of wavelength, confirmation of light as a wave, and discovery of the infrared (IR) and ultraviolet (UV) regions of the electromagnetic spectrum (EMS).
As is the case with many other sciences during the First and Second World Wars, remote sensing saw considerable advances and adoption with the development of camera technology and aerial reconnaissance, radar, and orbit-capable rockets. Similarly, the Space Race and Cold War propelled the development of orbital remote sensing. Beginning in 1957 with Sputnik, space research was the focus of most early missions. With EO platforms largely used for weather, atmospheric research, and defence, it was around this time that satellite-generated imagery of Earth was possibly at its most inaccessible since becoming a reality.
Per NASA, the 1972 launch of the Earth Resources Technology Satellite (ERTS) was the first wherein the primary aim was to observe the Earth system. Now known as Landsat 1, this platform was the progenitor of the most iconic lineage of EO satellites, a series that saw its ninth addition in 2021. Founded nearly 20 years after NASA and three years after ERTS became active, the European Space Agency (ESA) has been quick to catch up on the progress of its American counterpart. In the realm of EO, ESA’s contribution to the European multi-agency Copernicus program, the Sentinel missions, represents one of the most popular and prolific sources of free data and software.
The commercialisation of EO is a comparatively new trend, at least relative to that of satellite-based telecommunications. Fuelled by advances in rocketry, both in terms of the science and launch capacity (see SpaceX), deploying proprietary platforms has never been easier. It could be argued that this has precipitated a new kind of Space Race, one in which non-state vendors compete to provide data with the best quality and coverage.
Now, while the domain is arguably up there with the most globally important (or at least the potential to be) and subtly widespread, it somehow seems underutilised. Beyond their preferred navigation application and images used by media organisations during crises, most have little awareness of the kind of remote sensing discussed here, let alone direct interaction. Even then, vector basemaps are typically used as the more digestible default of most application’s basemap offerings as opposed to the regularly updated, high-resolution imagery mosaics.
Fundamentals
Continuing the theme of an introduction to remote sensing textbook, some foundational particulars can help shed light on an immensely technical field.
The four fundamental resolutions associated with remotely sensed data are spatial, temporal, spectral, and radiometric resolution.
Spatial resolution refers to the distance between sample points (pixels) in a georeferenced image (i.e., an image that "knows" its position on a planetary surface). In effect, it dictates the minimum size of an object discernible by a sensor. Rather contradictorily, the smaller the pixel (or area thereby covered), the higher the resolution and therefore the detail in the image. Higher spatial resolution data comes with its drawbacks, particularly transfer and processing times, storage space, and associated cost. As such, it’s key to consider what resolution is necessary for your application.
 to 10m (centre) to 100m (right).") Demonstration of the effects of spatial resolution, from 0.1m (left) to 10m (centre) to 100m (right).
Demonstration of the effects of spatial resolution, from 0.1m (left) to 10m (centre) to 100m (right).
Temporal resolution, sometimes known as revisit time, describes the time between independent acquisitions of imagery or the capability to do so for a given location. Areas imaged with each orbit typically overlap to varying degrees, locations within which see lower revisit times. This is especially prevalent towards the poles, where orbit tracks converge. Repeat cycle, however, is the time taken for a satellite to complete a cycle of orbits, reaching the same position as that which it started. Concerning satellite constellations (that is, missions comprising two or more platforms), temporal resolution may be given for both an individual satellite and the constellation at large. For example, the repeat cycle of a single Sentinel-2 satellite is 10 days. Between the Sentinel-2 mission's two constituent members, A and B, this is cut exactly in half. Upcoming additions C and D will see this halved again, assuming the current platforms are extant.
Spectral resolution concerns the regions of the EMS in which a sensor can measure radiation. Most sensors can detect and distinguish much more than the human eye – and not just in terms of perspective – observing energy in many more subsets of the spectrum. These subsets can comprise individual wavelengths or groupings thereof and may be termed channels, wavebands, spectral bands, or just bands. The greater the number of bands (sampling rate) and/or the smaller the width of said bands (bandwidth), the higher the spectral resolution of a sensor. Bands are useful as materials respond differently to wavelengths of varying size. For example, healthy vegetation reflects strongly in the near-infrared (NIR) but less so in the visible and shortwave-infrared (SWIR). Conversely, water reflects much more of the light we can see than it does infrared. Continuing the theme of concepts with many aliases, the reflectance of a given material across the spectrum might be called its spectral signature, response, or profile. Like data of increasing spatial resolution, that of increasing spectral resolution also demands higher storage volume, processing time, and fees.
 Comparison of spectral resolution across three major public EO platforms, Landsat 7 and 8, and Sentinel-2 A and B. Source: USGS.
Radiometric resolution is oft neglected - vital in using data but rarely making it to the marketing material. Also called bit depth, it dictates the number of values a pixel can take on. A greater number of possible values equates to a greater number of possible shades, and more shades equates to more detail. An easy way to determine the range of possible values is exponentiation of 2 by the number of bits. To demonstrate the above: pixels in 2-bit data may have one of four values: 0, 1, 2, or 3; 8-bit between 0 and 255; while those in 16-bit data can range from 0 to 65,535. Again, data of higher radiometric resolution will occupy more storage space.
 to 8-bit and 256 possible values (right).") Demonstration of the effects of radiometric resolution, from 2-bit and four possible values (left) to 8-bit and 256 possible values (right).
Demonstration of the effects of radiometric resolution, from 2-bit and four possible values (left) to 8-bit and 256 possible values (right).
View angle is another critical consideration when deciding on data. Nadir (pronounced nay-deer or nay-dur, depending on where you're from) is the point directly below an observer, in this context the sensor. In imagery, the off-nadir angle (ONA) is the angle, relative to nadir (0°), at which imagery is acquired. Imagery may be called oblique when the ONA is or exceeds 45°. Sometimes, imagery is intentionally collected at certain ONAs for its usefulness in determining dimensions. Photogrammetry comprises the stitching together of data acquired at different view angles to create 3D models like those seen in Google Earth/Maps and Apple Maps and used to great effect in areas like construction and infrastructure. The multi-angle imaging spectroradiometer (MISR) aboard NASA’s Terra satellite constitutes nine varyingly angled cameras previously used in estimating the volume of volcanic ash clouds and modelling forest canopy structure.
There exist two types of sensor in the context of EMR measurement. The most prevalent are passive sensors measuring the radiant (reflected, emitted, or transmitted) energy from surfaces. The second, active, are accompanied by their own source of emitted energy, the returned amount of which forms the basis of measurements and the data derived thereof.
Some examples of common processing applied to remotely sensed imagery include:
- Atmospheric correction – mitigating the negative effects of the atmosphere on measured EMR.
- Cloud masking – removing cloud and cloud shadow from consideration in analyses.
- Pansharpening (and more recently, super-resolution) – increasing the spatial resolution of data with the aid of traditional and/or ML-based approaches.
- Geometric correction and orthorectification – remediation of geometric inaccuracies/distortion introduced by the sensor (e.g. altitude variation and perspective), terrain, and curvature.
- Spectral index calculation - equations applied to combinations of spectral bands to enhance the visibility of surface features like healthy vegetation, burnt areas, geology, water bodies, and many others.
- False colour compositing – assigning arrangements of bands to the red, green, and blue display channels to highlight and visualise features.
 to false colour (Red -> NIR, Green -> Red, Blue -> Green) (right).") Demonstration of spectral band colour compositing, from true colour (left) to false colour (Red -> NIR, Green -> Red, Blue -> Green) (right).
Demonstration of spectral band colour compositing, from true colour (left) to false colour (Red -> NIR, Green -> Red, Blue -> Green) (right).
From a business standpoint, some considerations when selecting data and processing applied thereto might include:
- Downlink time – time from acquisition to ingestion and availability.
- Storage – as mentioned, more data (be it due to any of the four resolutions) requires more storage space.
- In-house capability and capacity – can reliable processing and analysis be achieved with the available resources?
- Detail – while tempting to go for the highest resolution data, it’s not always necessary or beneficial.
Data from a single sensor may be termed multi-theme. This means that said data can be employed for a variety of applications including, but not limited to:
- Agriculture – precision application of inputs, health monitoring, and yield prediction.
- Meteorology – forecasting and observation.
- Mining – spectral detection and site evaluation.
- Construction and planning – environmental surveys, impact modelling, and progress reporting.
- Logistics – shipping, airports, and resource management.
- Disaster response – identifying and observing the worst affected or remote locations.
- Insurance – exposure and claims preparation, modelling, management, and verification.
- Finance – investment risk and potential.
Many of these contribute to or can be used collaboratively with another. For example, remotely sensed meteorological data underpins a great many other applications including agriculture and transport.
The market
The global satellite EO market serves a plethora of end-users across a multitude of sectors and, as the technology on offer advances, so too will those making use of it.
Per Statista, the end-users with the first and second largest shares in the worldwide satellite EO market in 2020 were government (including defence) and energy and natural resources, a trend forecast to continue into the 2030s. Also forecast is the more than doubling (138% increase to be more exact) of the market’s total value.
An EUSPA (European Union Agency for the Space Programme) review reports a similar proportional increase though less optimistic current and projected absolute market values at €2.8 billion in 2024 to over €5.5 billion within the decade. Interestingly, value-added services are reported as the chief contributor at some four times greater than the data itself. Insurance and finance are also noted specifically as sectors due to experience significant, rapid appreciation of the value and potential of satellite EO.
 and market share by industry (right). Source: EUSPA.") Charts illustrating the rise of EO data and services sales (left) and market share by industry (right). Source: EUSPA.
Charts illustrating the rise of EO data and services sales (left) and market share by industry (right). Source: EUSPA.
A likely driver of the recent and continued rise, among many, is the democratisation of data in the advent of freely available data. Key providers of such public remotely sensed data include NASA (National Aeronautics and Space Administration), NOAA (National Oceanic and Atmospheric administration), USGS (United States Geological Survey), ESA (European Space Agency), and JAXA (Japanese Aerospace Exploration Agency). However, this has not always been so. Despite the program’s extensive history, Landsat-generated data only became free to the public in 2008.
Public vs. Private (Sectors)
One symptom of the rapidly growing market is the number of non-state enterprises joining the fray. Over the last few decades, particularly since 2010, a wealth of commercial entities offering data acquired by proprietary platforms have sprung up, with more following every year. Some of the most significant of these include Maxar, Planet, Airbus, ICEYE, and Capella Space. Though the latter two of those listed deal in SAR, most commercial entities operate in the multispectral domain – unsurprising given its popularity, due in large part to ease of interpretation. Thus far, the focus of most such companies is on what’s called very-high-resolution (VHR) data – typically around or below 50 cm. Aerial providers (if you thought satellite-generated data was expensive, think again!) regularly offer sub-10 cm resolution imagery. Like that of its space-acquired counterpart, data collected by national entities (like NOAA, USGS, and the Environment Agency) is also free, but less regularly or predictably collected.
Like that surrounding data, there’s also a question of free vs. paid-for software to process, analyse, and visualise remote sensing products, but that’s for another time!
Choosing a partner
With the meteoric rise in the number of data vendors comes the even greater rise of analytics and consultancy companies. Finding the right partner for geospatial analytics, particularly that of remotely sensed data, isn’t straightforward. Like any other industry, there exist many purveyors of snake oil. These may use remote sensing, earth observation, AI/ML, GIS, and more as buzz words masking an insufficient understanding of the domain at their disposal. Many simply don’t have the right expertise to utilise data and techniques to their fullest potential.
The right way to apply remote sensing and its products is complex. The insights to be gained are diverse and numerous but can be labyrinthian to attain. At GeoTech, we can help you determine if you need EO products, to what extent they can be utilised, and help realise that potential with confidence in honest, informed answers.