What is GIS?
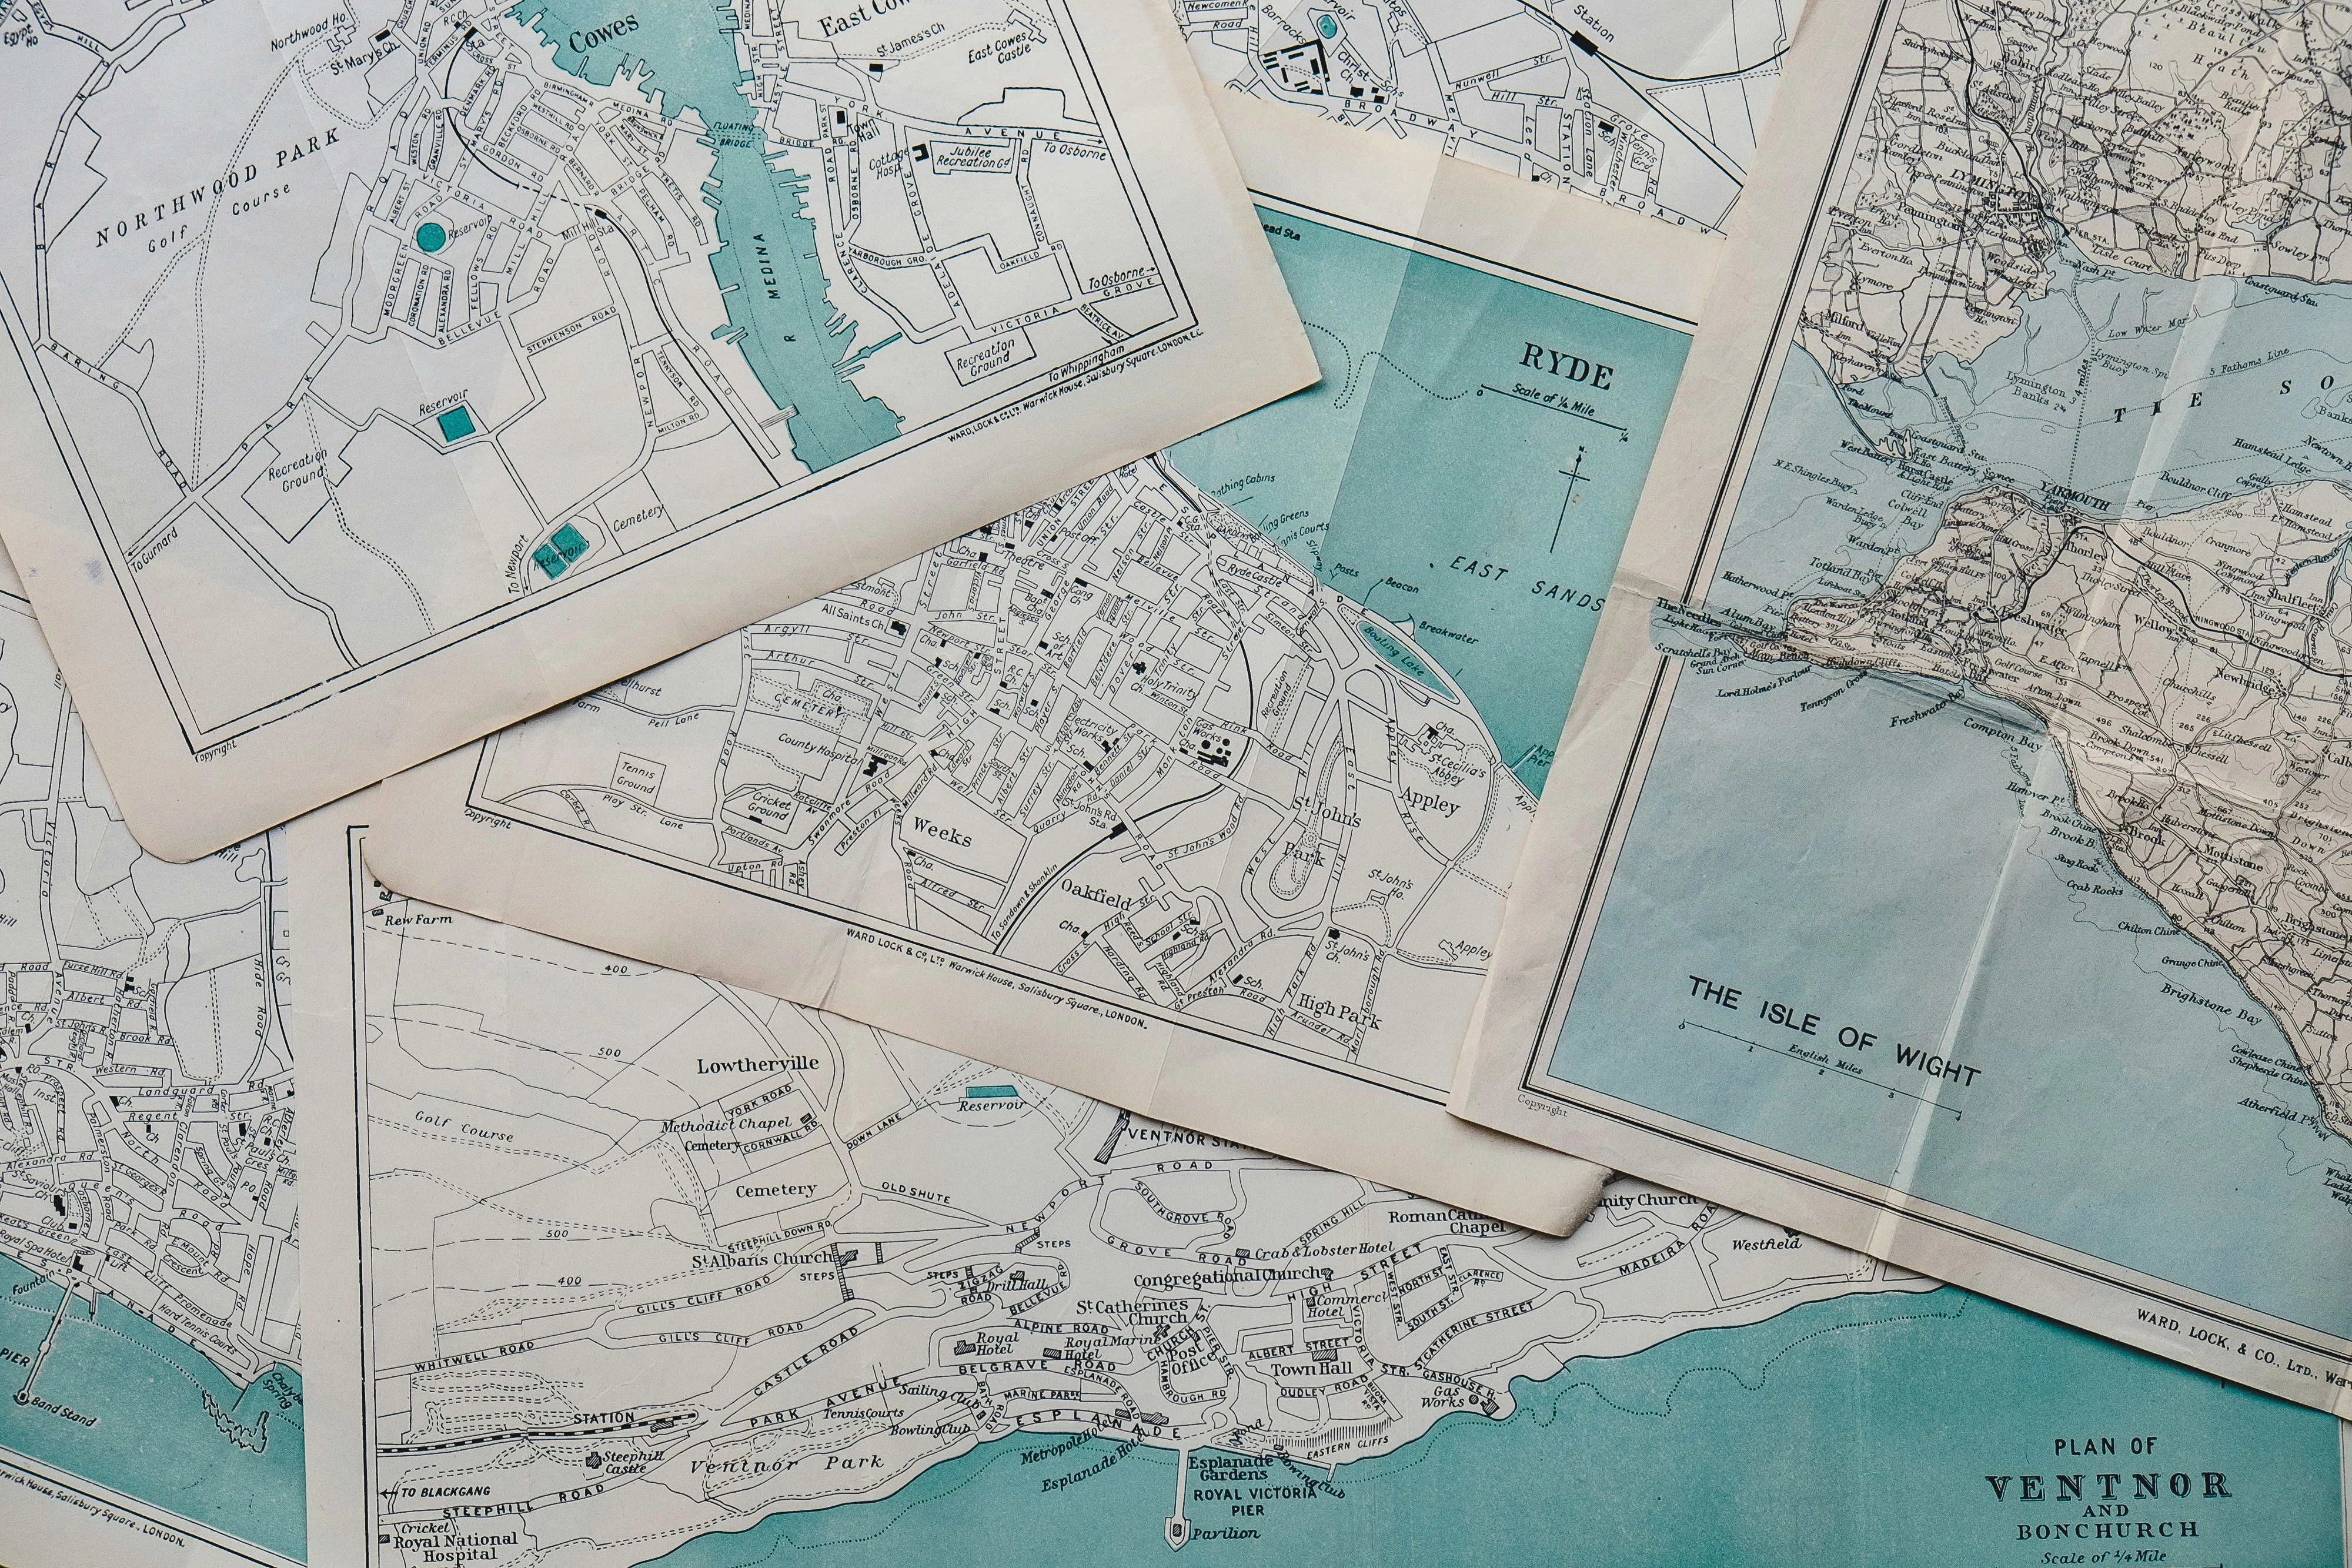
GIS - you've almost certainly used it, but do you know what it is?
Geographic Information Systems, GIS for short, constitutes a powerful set of rules and tools for collecting, manipulating, analysing, visualising, and storing geospatial data. That may sound like a lot (it is) but it’s this versatility and the ever-increasing generation of spatial data that sees the domain in its present heyday. In fact, a common aphorism is that most people use GIS every day, cognizant or not. Any application actively using geographic data, be it navigation, dating, or shopping uses GIS to some extent.
That said, one of the more prominent kinks to be ironed out for many organisations is whether GIS and all it encompasses is of value and suits their needs. Within this comes the question of how to use it safely and reliably to maximise its impact and effectiveness.
If that preamble was enough to pique your interest, then this is the post for you! The remainder will give an overview of the domain and industry as they were, are, and might be, as well as if and how GIS could be a formidable apparatus in your repertoire.
History
Akin to our What is Remote Sensing? article, here’s a little history to set the scene.
A classic example of early GIS taught in every introductory course is that of John Snow – no, not the Channel 4 news presenter or similarly named George R. R. Martin character. In relating cases of cholera to the locations of water pumps in Soho, London in 1854, Snow carried out one of the first well-known spatial analyses. (Though evidence suggests such an approach had been in use by epidemiologists for some time prior.)
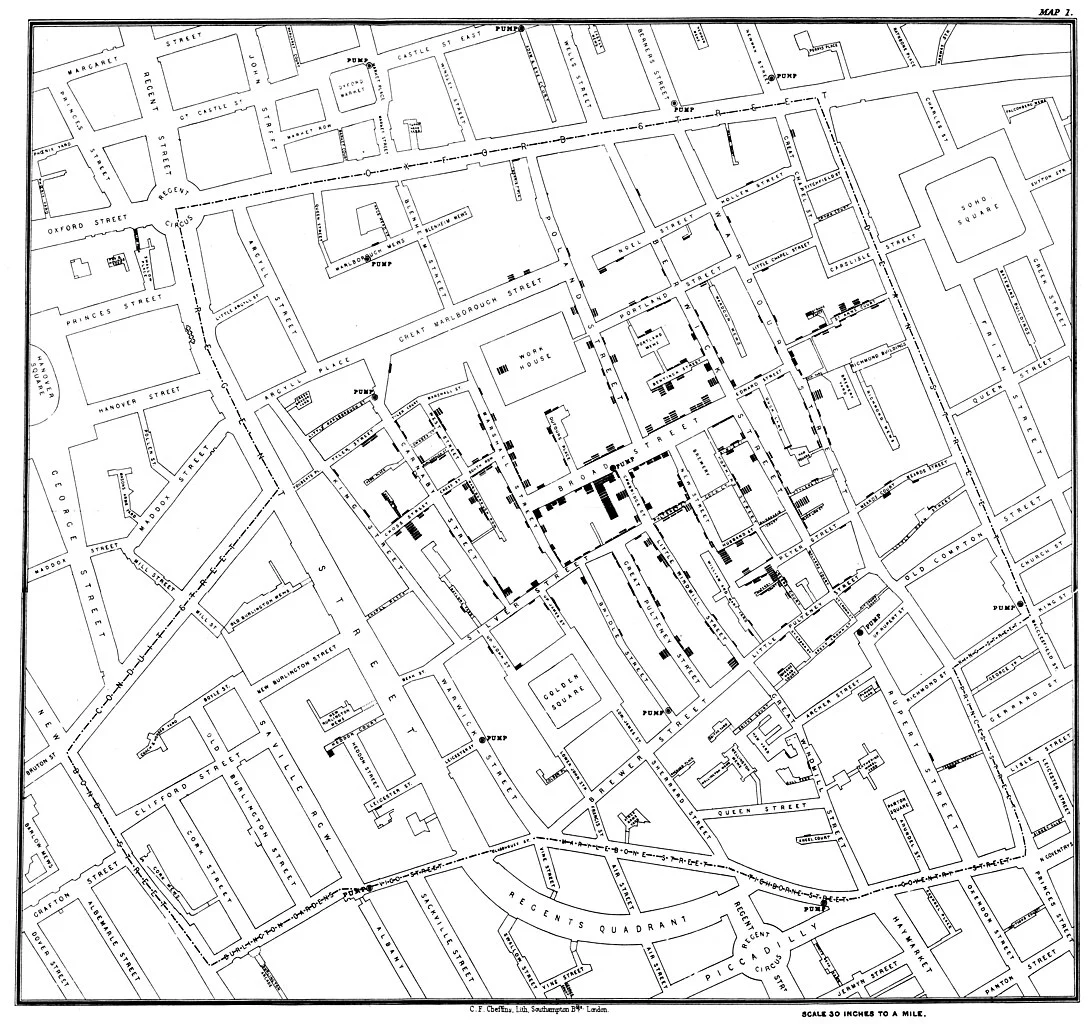 John Snow's dot distribution map used in his analysis of the 1854 Soho cholera outbreak.
Like that mentioned in our What is Remote Sensing? Blog, GIS is no exception to the advancements often made through military applications. In fact, one of the most widely adopted innovations produced by military R&D is the Global Positioning System (GPS)! This summary by David Swann in Geographical Information Systems Abridged makes abundantly clear the benefit of improved mapping and spatial analysis to the armed forces.
In the prior few decades, the domain has seen a gentle but profound integration into everyday use in mainstream society. The new chain supermarket in your area? GIS and multi-criteria evaluation was responsible for choosing its optimal location. Ever ordered a trip or restaurant delivery? Uber’s now open-source H3 geospatial indexing system improves the speed and efficiency of querying location data. And we’ve all used a journey planner at some point. Nowadays, these are typically those found in navigation apps like Google or Apple Maps, but the first route planners appeared in the late 1980s as internal means for transit providers and authorities to guide prospective customers on journeys. Through the 1990s, these evolved into more publicly accessible disc-installable programs and again into specialised websites like MapQuest and the AA Route Planner.
A watershed in the history of GIS is the creation of the Geospatial Data Abstraction Library (GDAL). First released in 2000 and used for reading, writing, and transformation of spatial data, this software library underpins virtually every GIS application in existence today. Similarly critical is PROJ, used for projection conversion and dating back to the 1970s. The abundance and adoption of open-source GIS technologies led to the 1994 and 2006 foundings of the Open Geospatial Consortium (OGC) and Open Source Geospatial Foundation (OSGeo), respectively. The former dictates standards for geospatial data and services while the latter manages and maintains software like GDAL. Such is their importance that OGC partners include Google, Amazon Web Services (AWS), Oracle, and numerous government agencies across the world, to name a few.
Fundamentals
To wax lyrical, GIS has a great many fundamental concepts that, once understood, really lend in appreciating the complexity of handling geospatial data and analyses thereof.
Perhaps the most critical foundation is the coordinate reference system (CRS), also termed spatial reference system (SRS). Put simply, these define locations on a surface, in this context planetary, and can be split into two subsets: geographic and projected coordinate systems (GCS and PCS). Regardless of subset, these are denoted by an authority, usually EPSG (from the European Petroleum Survey Group) and following numeric code.
Briefly, GCSs are those expressing points on a spherical or spheroidal surface through latitude and longitude coordinates and distance through angular units like degrees. Some of the more commonly used GCSs include WGS 84 (EPSG:4326), NAD83 (EPSG:4269), and OSGB36 (EPSG:4277).
PCSs effectively build on a GCS with a projection – a formula for displaying coordinates on a plane – and employ linear distance units like metres or feet. There are a great many projections, some local, specialised for accurate depictions and analysis of specific areas as small as a given settlement, and some global. No matter the area, all attempt to minimise distortion inherent to mapping a 3D surface on a 2D plane such as that of distance, angle, and area. The best analogy for this is to peel an orange in one and try to lay the peel flat – even if you succeed in doing so without further tearing the peel, you’ll notice stretching. Often encountered PCSs include Spherical Mercator (EPSG:3857), British National Grid (EPSG:27700), and WGS 84 UTM zones (EPSG:32600 to 32660 for northern hemisphere, 32700 to 32760 for southern). While used by most maps we see online, EPSG:3857 so heavily distorts with navigation away from the equator that by the poles it’s infinite. Also of note is that data using a GCS is often projected rectangularly to aid visualisation; at least relative to a 3D globe.
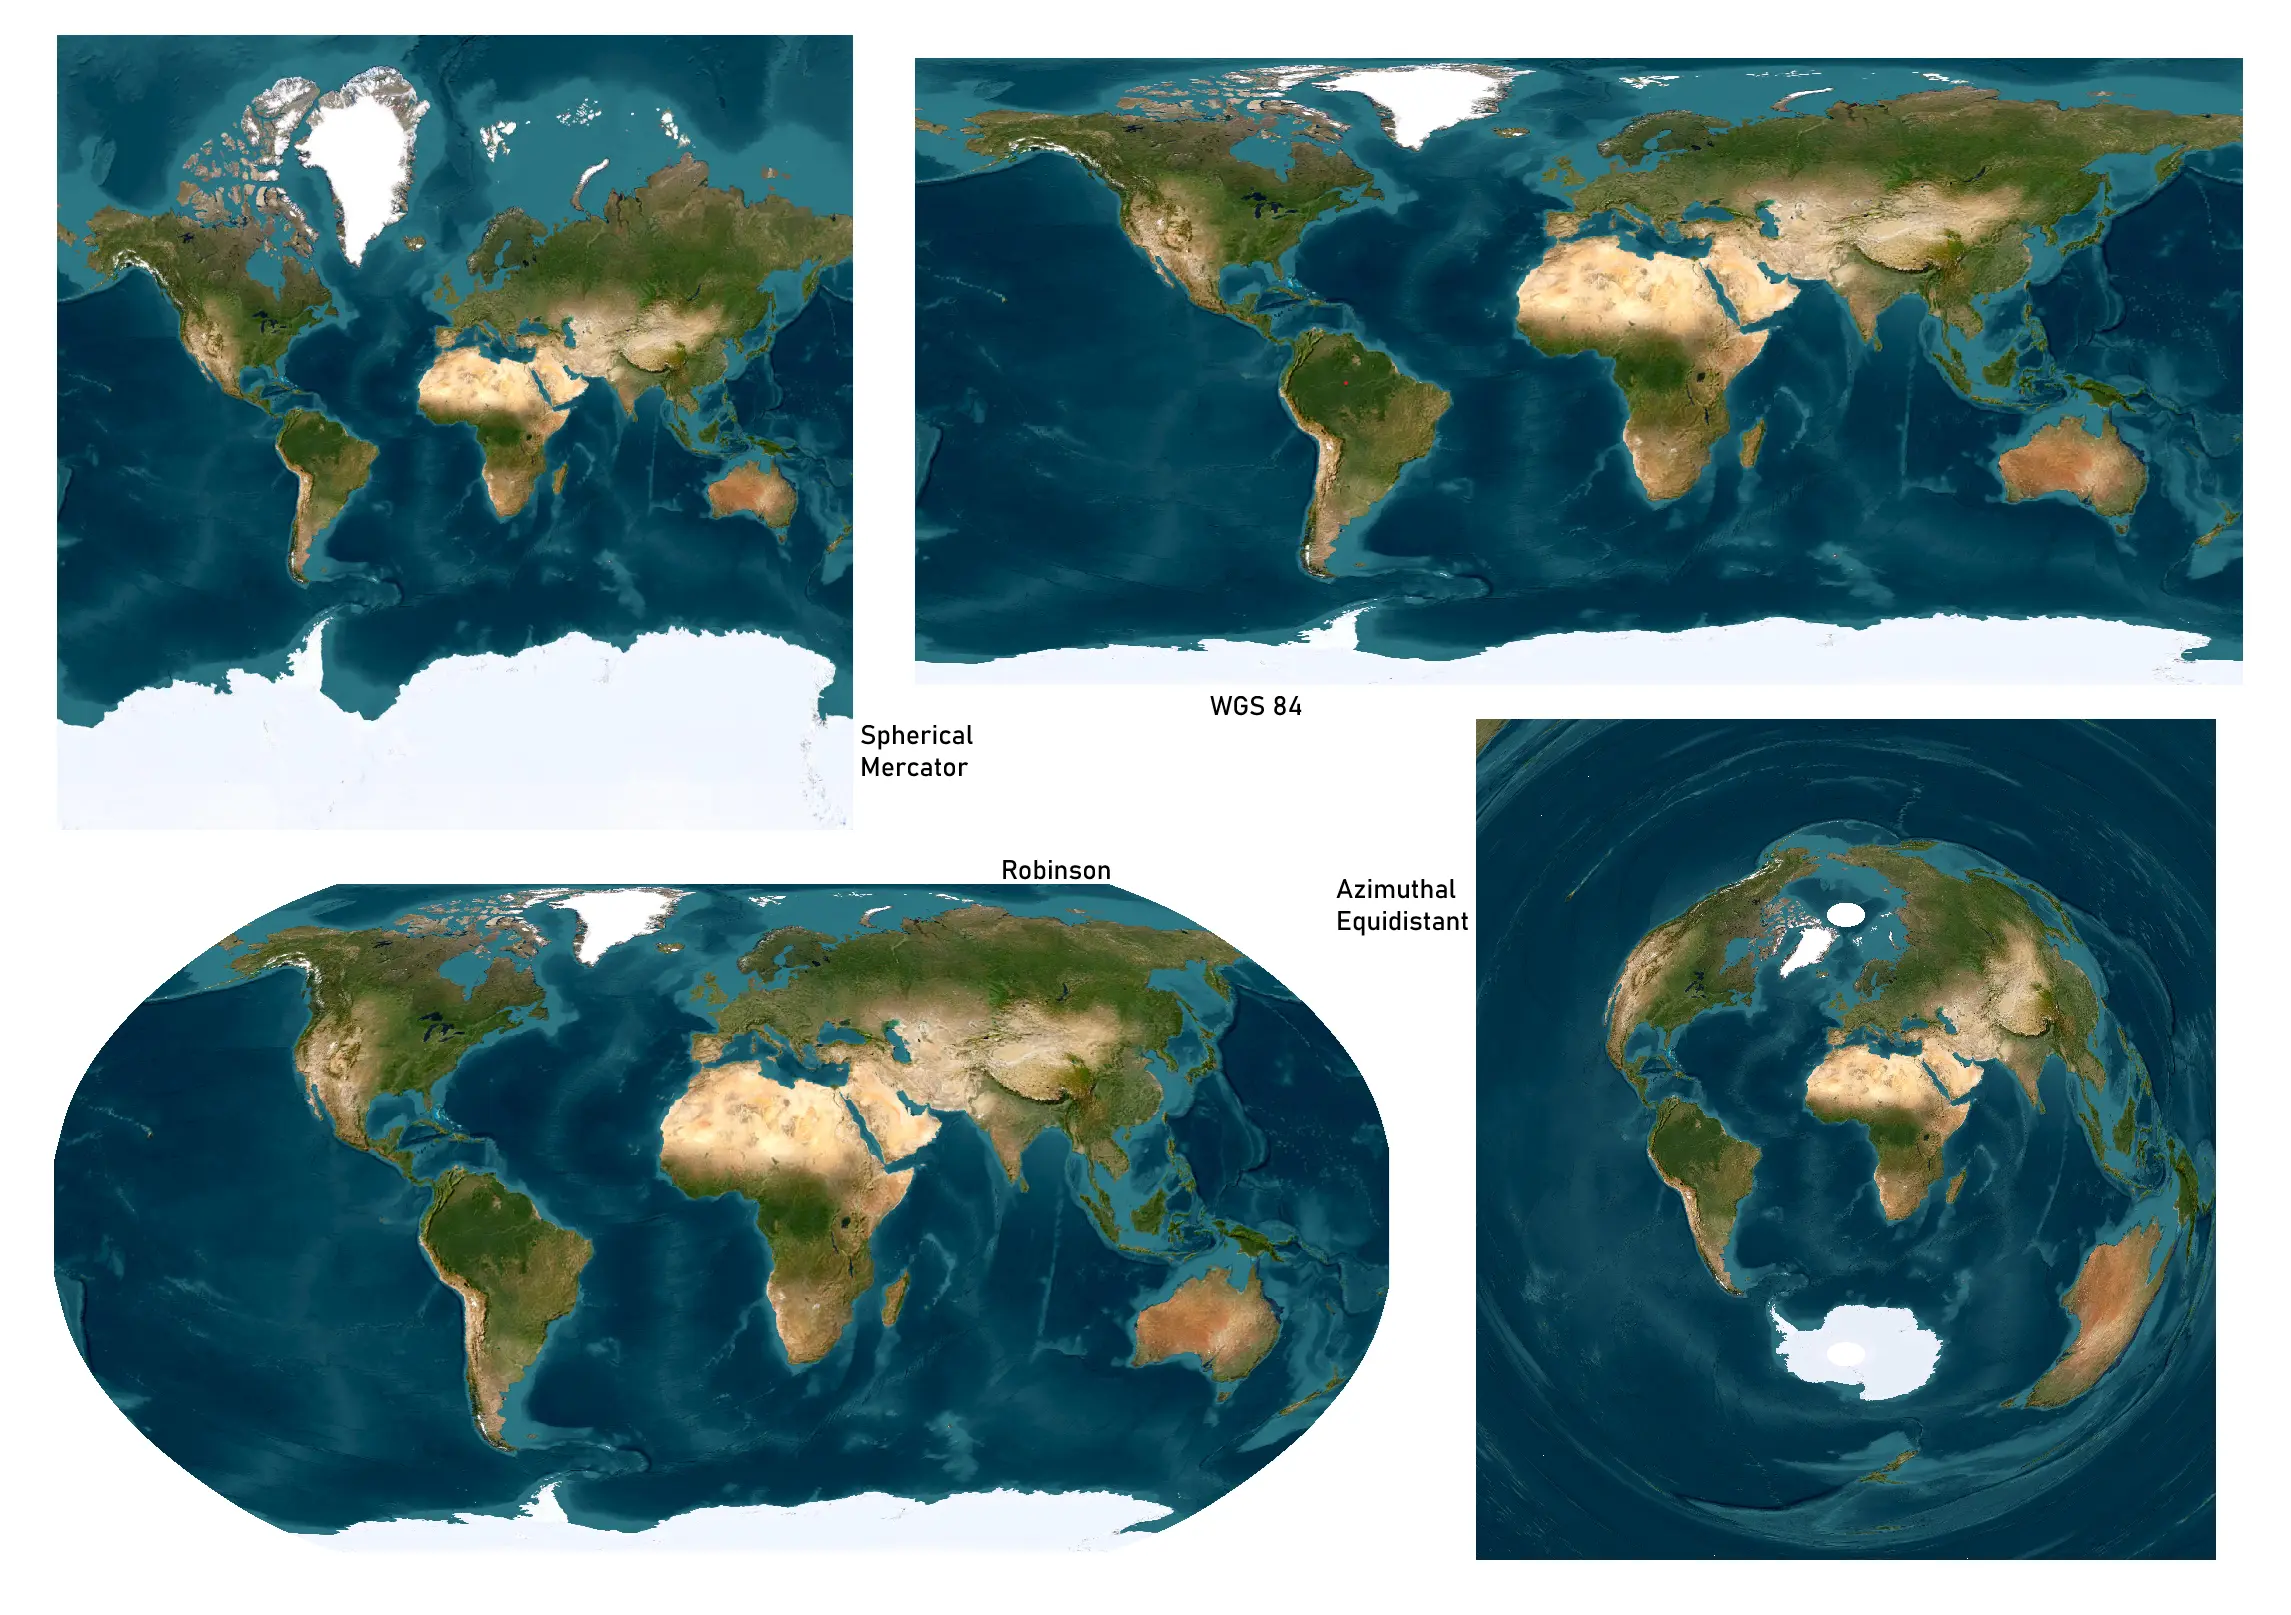 Four comparitively common global projections: Spherical Mercator, WGS 84, Robinson, and Azimuthal Equidistant.
Each CRS also has a reference point to which all coordinates relate. With most global CRSs like WGS 84, this point is found at the intersection of the prime meridian and equator and is colloquially named null island (though no island exists here). Coordinates are then a measure of distance in the given CRS’ unit from said point. In most GCSs, the coordinates 1, 1 represent the point 1 degree north and east of null island. In a PCS using metres as units, these coordinates would be 1 metre north and east.
CRSs may also be associated with a vertical datum constituting the elevation to which all other measurements thereof are relative. As you might expect, global systems or data typically use an estimate of global mean sea level as said reference. Conversely, individual nations or regions often calculate their own for improved accuracy. Ordnance Datum Newlyn (ODN) is that of the U.K. and comprises the average sea level recorded at a station in the Cornish town of Newlyn between 1915 and 1921 – not what you might have expected! Similarly surprising in location, the North American Vertical Datum of 1988 (NAVD 88) has its own reference point at Rimouski, Quebec.
Another fundamental element of CRSs and the mapping of planetary surfaces is the model of that surface. The Earth, as with many planetary bodies, is not perfectly spherical. Instead, due to centrifugal force resulting from rotation, it takes the shape of an oblate spheroid – effectively a slightly squashed sphere. Approximations of this shape that form a key part of CRSs are known as the reference ellipsoid or ellipsoid model, of which there are numerous. More accurate models like the geoid are less frequently used due to complexity.
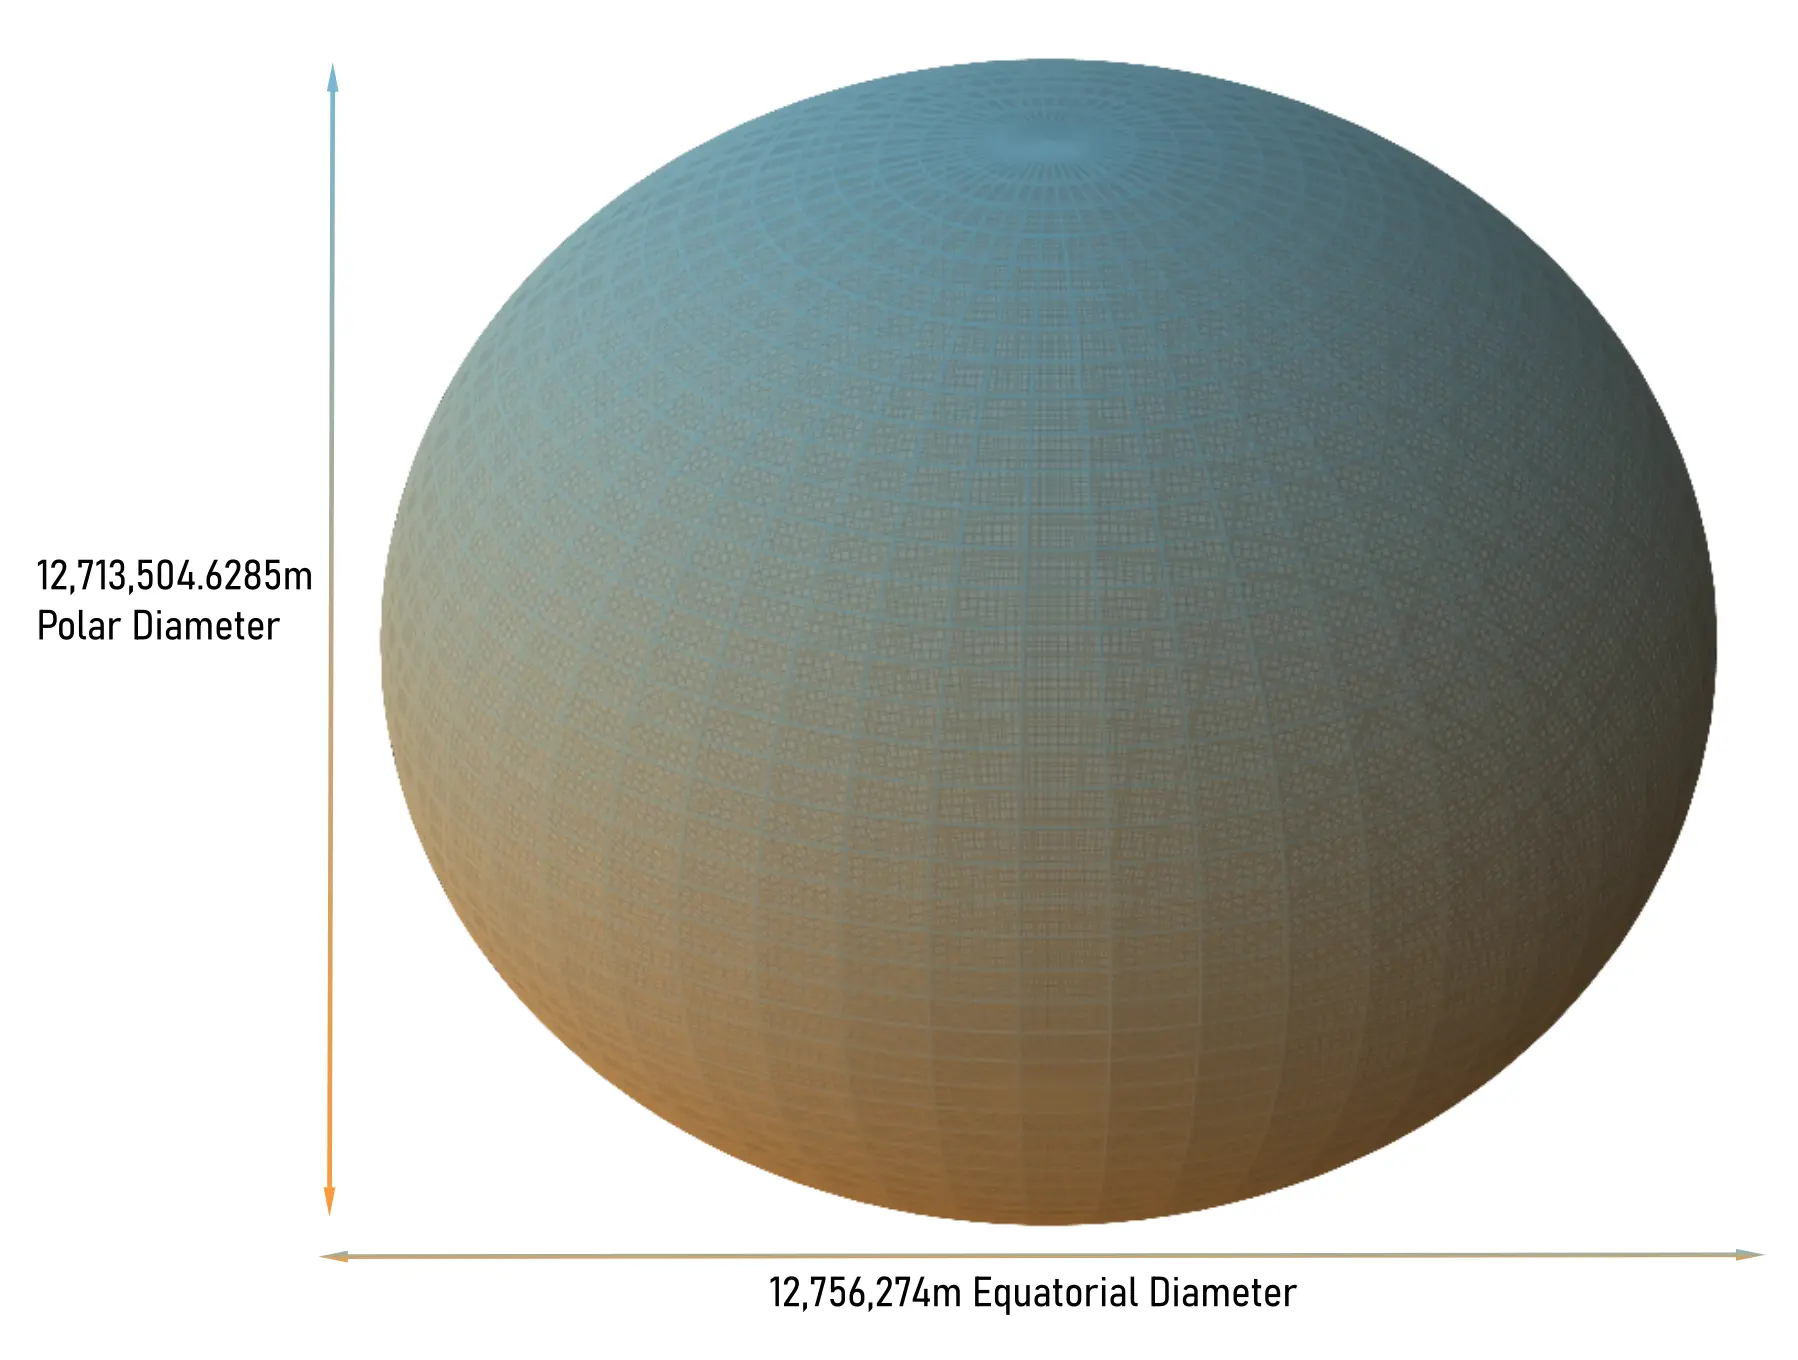 The WGS 84 ellipsoid model.
A brilliant resource for exploring CRSs can be found at epsg.io.
In terms of data types, the two most common are raster and vector, each suited to different uses. Thankfully, it’s typically abundantly clear which uses they are!
Raster data is, put simply, an image. Made up of picture elements (pixels), each of which can have one or multiple values (digital numbers, DNs) corresponding to measurements of different variables (bands or channels), and associated metadata. It’s best used for quantification of continuous phenomena like elevation or temperature. In the case of a typical photo, metadata might include camera, sensor, or shutter properties, image size, timestamp, and even location. Georeferenced rasters aren’t all that dissimilar, augmented by metadata detailing geographic properties like coordinate system and origin. Those derived from satellite observations might also sensor-specific values like view and solar illumination angles. Of the numerous raster formats, the GeoTIFF is by far and away the most widespread, distantly followed by others like JPEG2000, MrSID, IMG, ECW, and BIL.
Vector data is most often (and best) applied to discrete information like administrative boundaries and comes in three flavours: points, lines, and polygons. Each represent locations or features in different ways with the fundamental similarity being nodes (also called vertices). The location of these nodes is typically defined by a pair of coordinates (X and Y), though a third coordinate for expressing elevation (Z) may be present. Nodes are connected by lines and edges with line and polygon data, respectively. While data values are represented by DNs in raster data, an attribute table not unlike an Excel spreadsheet holds those of vector data. Here, fields contain values for distinct attributes with records (rows) comprising values for each field as well as a geometry. Data may also be multi-geometry, meaning at least two distinct geometries reference the same attributes. Common formats include GeoPackage (a GIS-ready SQLite database), shapefile, file geodatabase, and GeoJSON, though relative newcomer GeoParquet is my personal favourite.
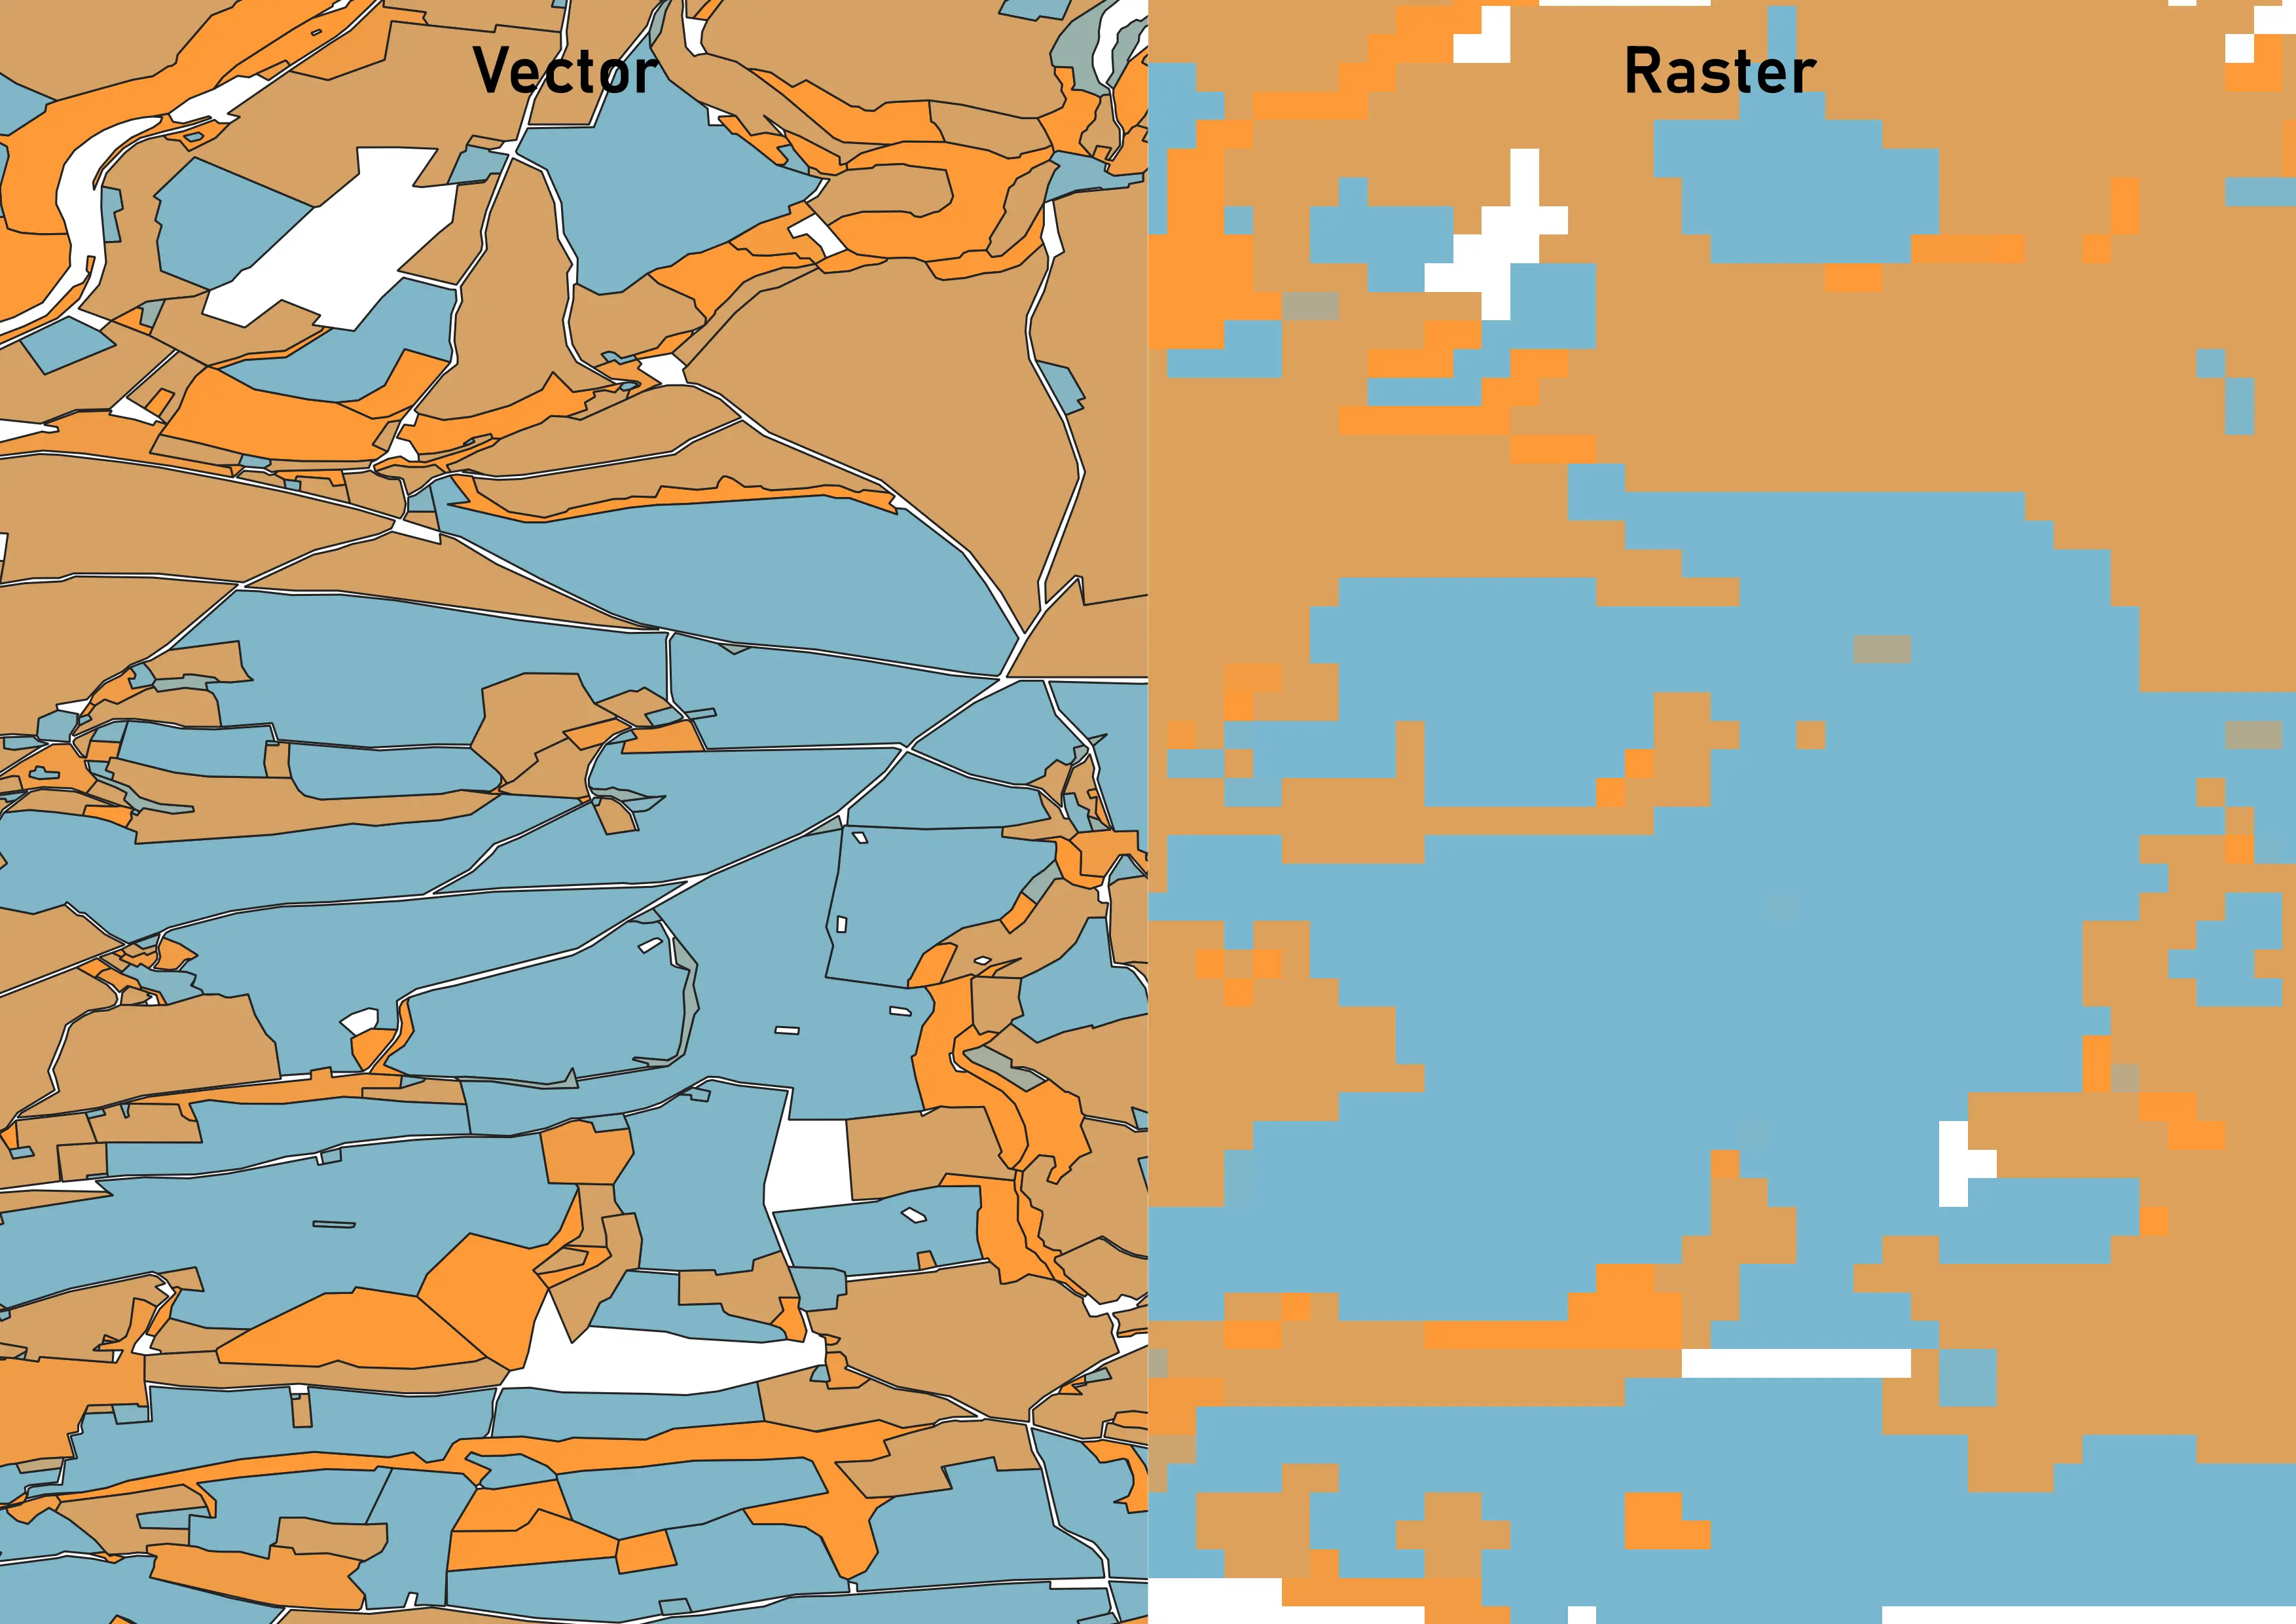 A comparison between vector and raster land-use data.
Less common but still vital in everyday use is mesh (or lattice) data. Closest to rasters but with notable differences to save for later discussion, this format is most often utilised for meteorological and atmospheric data and includes formats like Network Common Data Form (NetCDF), Gridded Binary (GRIB), and Hierarchical Data Format (HDF).
Increasingly common in the age of web and cloud GIS are tile protocols. These versatile standards enable the efficient serving of remote geographical data to end users, often read-only. Web Feature Service (WFS), Web Map Service (WMS), and tiled web map (encompassing the Tile Map Service (TMS), Web Map Tile Service (WMTS), and XYZ tiles standards) are commonly taken approaches.
What are your options?
A great rivalry in a geospatial professional’s world is that between QGIS and Esri’s ArcGIS. As the most widely used desktop platforms with totally different distribution strategies – ArcGIS is closed source with considerable licence fees while QGIS is free and open-source – there’s much debate over the capability, usability, and cost vs. benefit of the two. That said, this article isn’t a who’s best but a lay of the land for those in need of an introduction to GIS. For now, we’ll leave the comparisons and rankings to these articles from GISGeography.
However, capable GISs are not limited to those with more traditional desktop graphical user interfaces (GUI):
- Cloud and web native: optimised for deployment in the cloud including GeoServer, MapServer, Carto, QGIS Server, ArcGIS Online, and Mapbox.
- Command line: while often abstracted into GUI form, utilities like GDAL and OGR can be accessed through command line interfaces (CLI). The OSGeo shell is an effective way of doing so for both tools in one installation.
- Databases: PostgreSQL, one of the most widely used relational database management systems (RDBMS), supports a geospatial extension named PostGIS. A testament to the popularity of this plugin is its inclusion in the short list of those offered on install of Postgres itself.
- Programming languages: while most are equipped to handle spatial applications, Python possesses without a doubt the most mature ecosystem, greatly aided by the rapidity with which solutions can be made inherent to the language.
- Distributed processing: Apache Sedona and Apache Spark are increasingly common in large scale parallel and distributed cluster computing of spatial data.
Other software may target a specific niche, with some covering a broader scope than others.
| Software | Creator / Maintainer | Open source | Purpose |
|---|---|---|---|
| ENVI | L3Harris / NV5 | No | Remote sensing imagery analysis |
| ERDAS IMAGINE | Hexagon | No | Remote sensing imagery analysis |
| Sentinel Applications Toolbox (SNAP) | European Space Agency | Yes | Remote sensing imagery analysis |
| Orfeo Toolbox (OTB) | National Centre for Space Studies | Yes | Remote sensing imagery analysis |
| GeoDa | University of Chicago | Yes | Statistical analysis |
| SAGA GIS | University of Göttingen | Yes | Geoscience |
| HEC-RAS | United States Army Corps of Engineers | No, free use | Flood modelling |
| Panoply | National Aeronautics and Space Administration | No, free use | Meteorological data visualisation |
| Cyclone | Leica Geosystems | No | Point cloud processing |
You also needn’t be locked in to using software distributed by any one vendor. Many individuals and organisations use a sort of Frankenstein’s Swiss Army knife approach, using tools from a wide range of sources. A common, largely open-source stack might include:
- QGIS for feasibility studies, R&D, or limited run bespoke work.
- AWS S3 or Azure Blob Storage for storing and/or serving unstructured data.
- PostgreSQL and PostGIS for structured data storage, management, and querying.
- Python and libraries like Rasterio and GeoPandas for highly customised, automated ETL and analysis.
- Apache Sedona for large scale processing.
- GeoServer for serving larger volumes of data, particularly very-high-resolution imagery.
- Leaflet or OpenLayers for web-based mapping of data.
The benefit of such an arsenal comes primarily in its cost. The absence of licence fees means that the most expensive parts are infrastructure and upkeep. However, self-hosted services can be harder to maintain, and the relative lack of centralisation may be off-putting. Conversely, other enterprises rely primarily or solely on the Esri suite from ArcPy to ArcGIS Pro to ArcGIS Online. Advantages to this include its centralisation in a single ecosystem and more extensive support. That said, this can leave organisations exposed to large increases in licencing fees, tiered support packages, and inflexibility relative to a more open-source approach.
Regardless of software or vendor, most, if not all, rely to varying degrees on open-source libraries like GDAL, OGR, and PROJ.
Applications and Adoption
As you may understand from prior knowledge or, if new to the topic, have inferred from this article; the applications of GIS are myriad. From economics to ecology, geospatial software and data is employed across the value chain, with new and innovative uses appearing what seems to be every day. Thinking of an application, domain, or industry in which GIS cannot be applied requires thinking of one in which no data whatsoever is or could be spatially aware – tough, right?
What can we do?
At GeoTech, we have a combined nearly 20 years’ commercial experience with GIS covering the full lifecycle of analysis and applications across a range of industries and domains. It’s through this experience that we know the world of GIS can be overwhelming and hard to navigate, so we're always happy to have a chat through any questions and/or problems you have. Please get in touch with us or reach out on LinkedIn if you'd like to learn more.